Usage
This section covers how to run an experiment on the system.
Definitions
- Trial: A single run of submitted code with a corresponding config file.
Accessing the System
When connected to the Rose-Hulman network, you can access the live system at https://glados.csse.rose-hulman.edu/.
If you need a local copy of the system, refer to the installation guide.
You must sign in with either a Google or GitHub account to run an experiment.
You may also access experiments from the GLADOS CLI (all documentation for it is there as well).
Preparing Your Code
GLADOS has limited support for experiments. To ensure your experiment runs properly, check whether it meets the compatibility requirements.
The main steps to prepare an experiment are:
- Ensure GLADOS supports your experiment. Details are available under Compatibility.
- Use a
.inifile to input parameters, passed as a command-line argument. - Output results to a CSV file, or return a single value as the output.
We provide example experiments in the repository. Consider using them as a guideline for formatting your experiment.
Your experiment must be configured to accept a .ini config file structured as follows:
[DEFAULT]
g = 5
p = 50
gl = 1
mr = 0.2
s = 1
You can format the generated .ini file using the "User Defined Constants" tab while creating an experiment. Use curly brackets {} to reference parameter names.
Example:
If you have a parameter named seed ranging from 1 to 10 (incrementing by 1), you can define it in the "User Defined Constants" tab as:
[SEED]
random_seed = {seed}
This allows additional .ini sections to be included dynamically.
Your experiment must also output results in a two-line CSV format with headers and corresponding values:
HeaderFor1, HeaderFor2
Result1, Result2
Note: If your CSV file contains more than two lines, you can specify which line should be used in the "Information" tab.
Java experiments must be packaged as an executable .jar file.
C experiments must be compiled into a Unix binary executable (for basic users).
Specific requirements are outlined under Compatibility.
Once your experiment is set up, proceed to Running the Experiment.
Compatibility
GLADOS supports experiments that:
- Run on Python 3.8 as a single Python file.
- Are packaged as an executable
.jarfile. - Are compiled into a binary executable for Unix systems, runnable on a base Debian system.
- Are contained in a zip file that includes one of the above file types.
Other experiment types may be supported, but testing is limited. Use at your own risk.
GLADOS supports complex outputs, including multiple files. However, data aggregation is currently limited to a single file.
After completion, you can download all generated files, organized by each trial run, in a Project Zip.
Future updates will improve support for dependencies and additional experiment types.
Extra Features
Note: These files can only be provided inside of zip files!
Users can provide a file called "userProvidedFileReqs.txt". This file is a Python requirements file. When this file is provided all packages will be automatically installed.
Privileged users have the option to provide two files:
-
packages.txt - this contains Debian packages to be installed to the runner.
-
commandsToRun.txt - this file contains bash commands that will be run on the runner after packages have been installed.
Running Experiments
To create a new experiment, click the "New Experiment" button below your email in the top-left corner of the dashboard.
Upon first login, your dashboard will be empty.
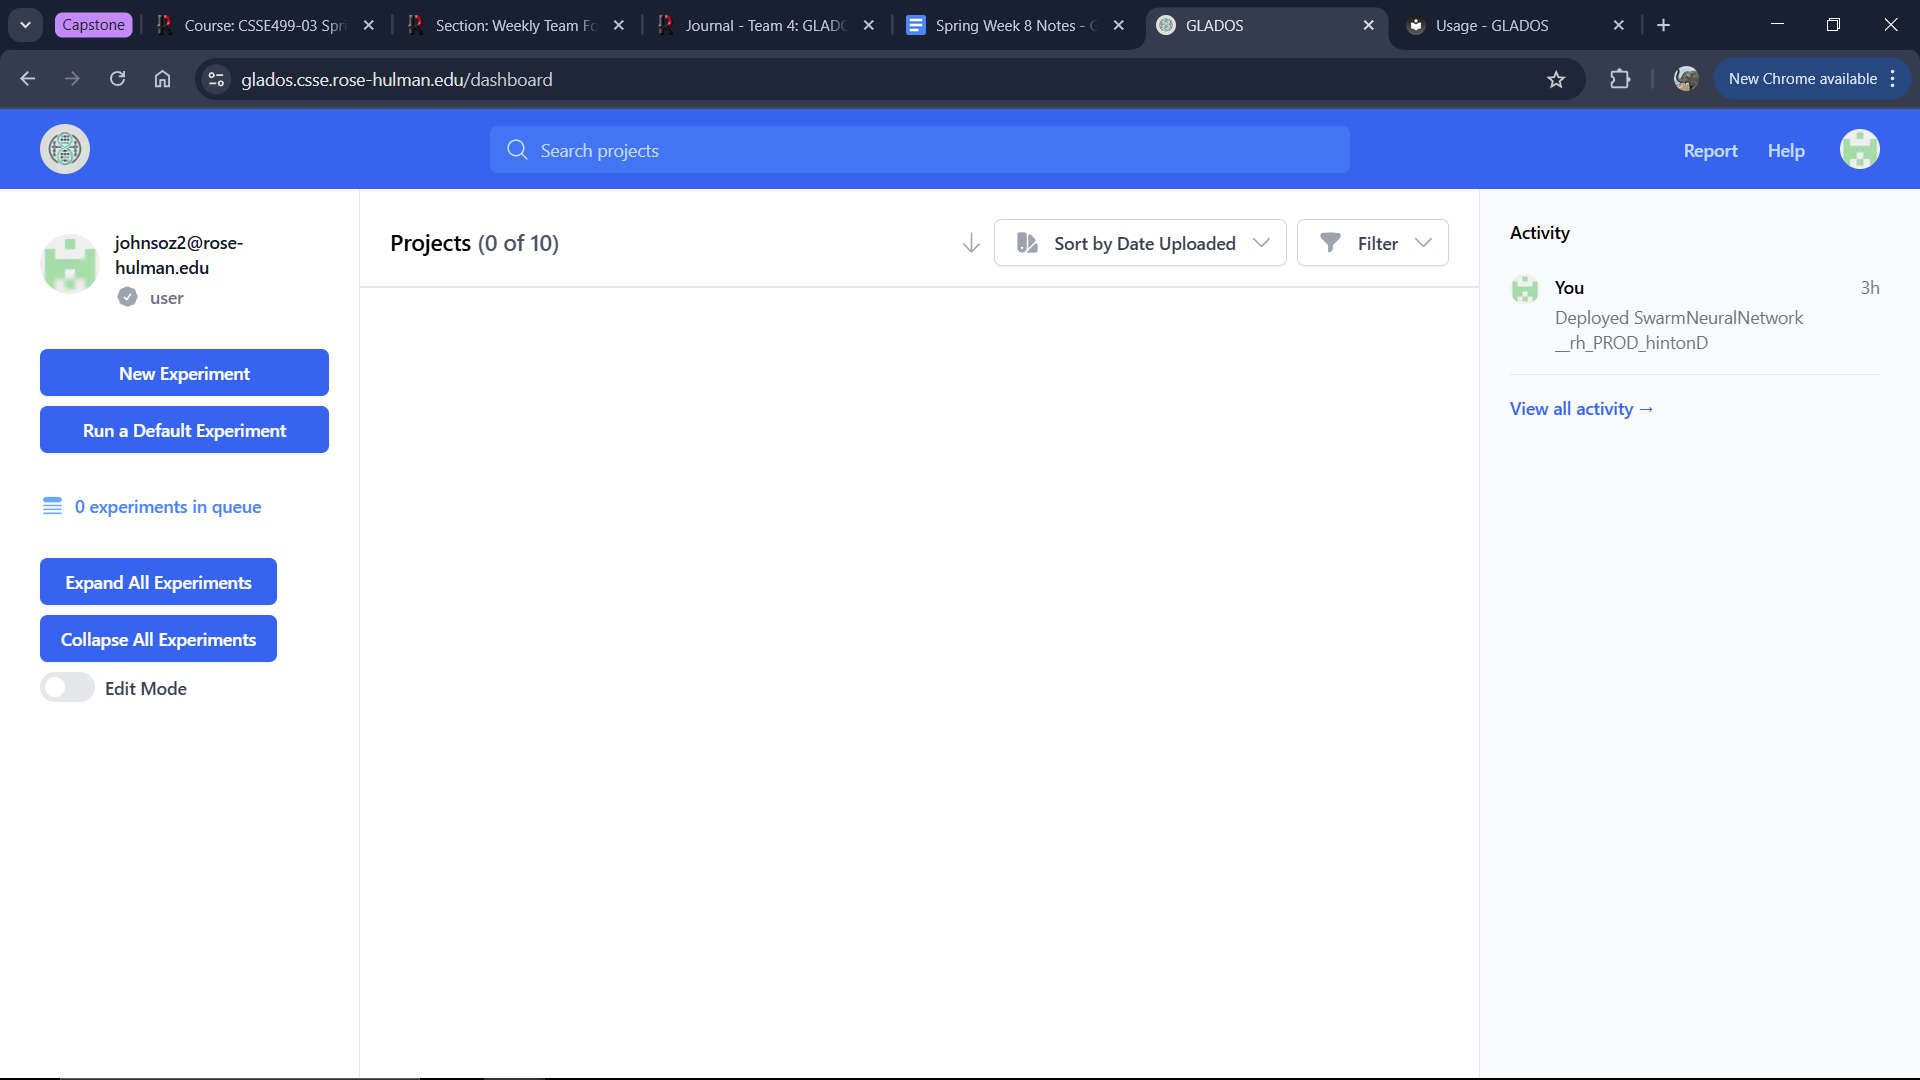
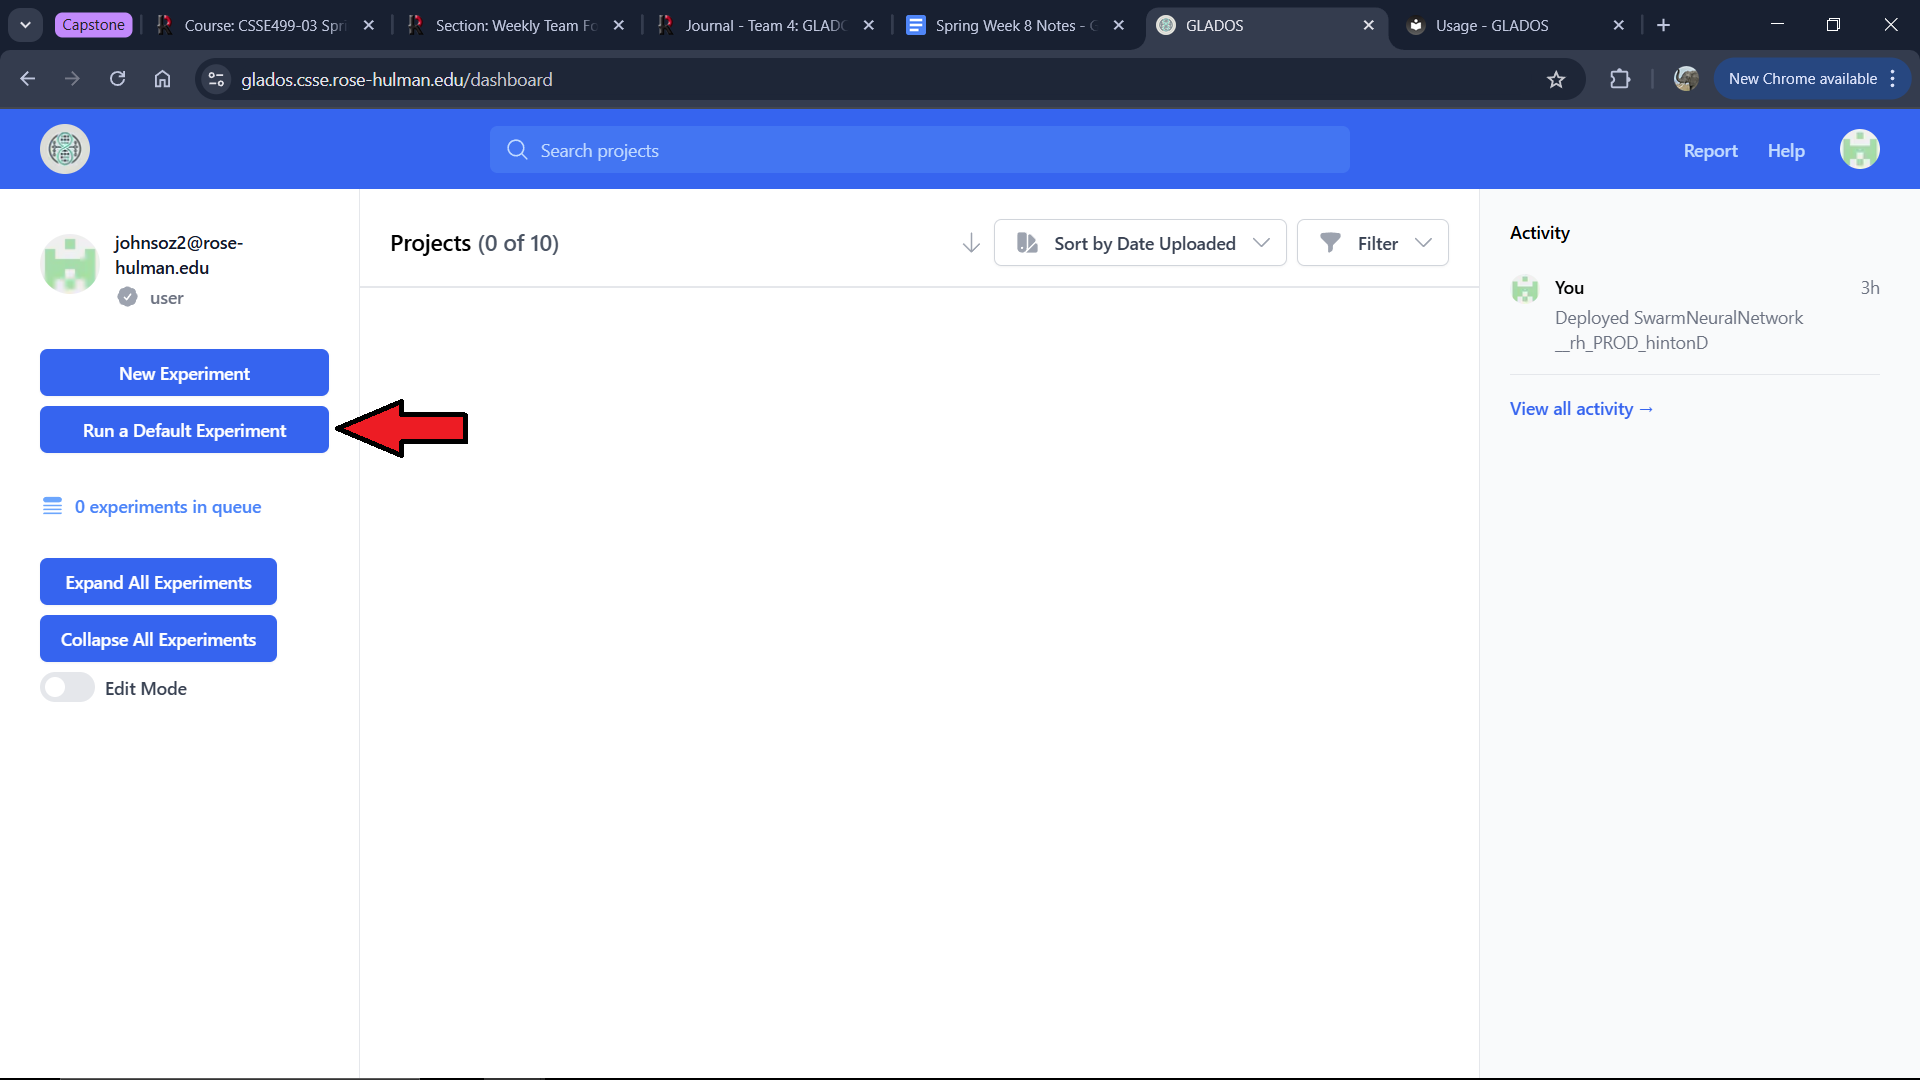
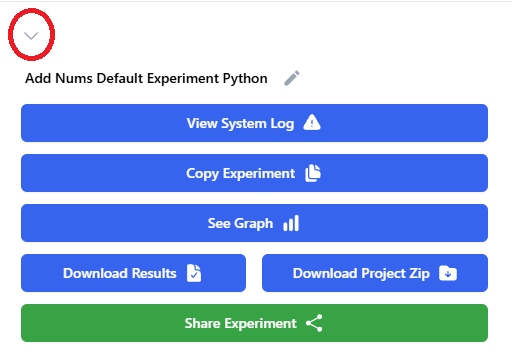
To run a default experiment, click the "Run a Default Experiment" button on the right side of the screen.
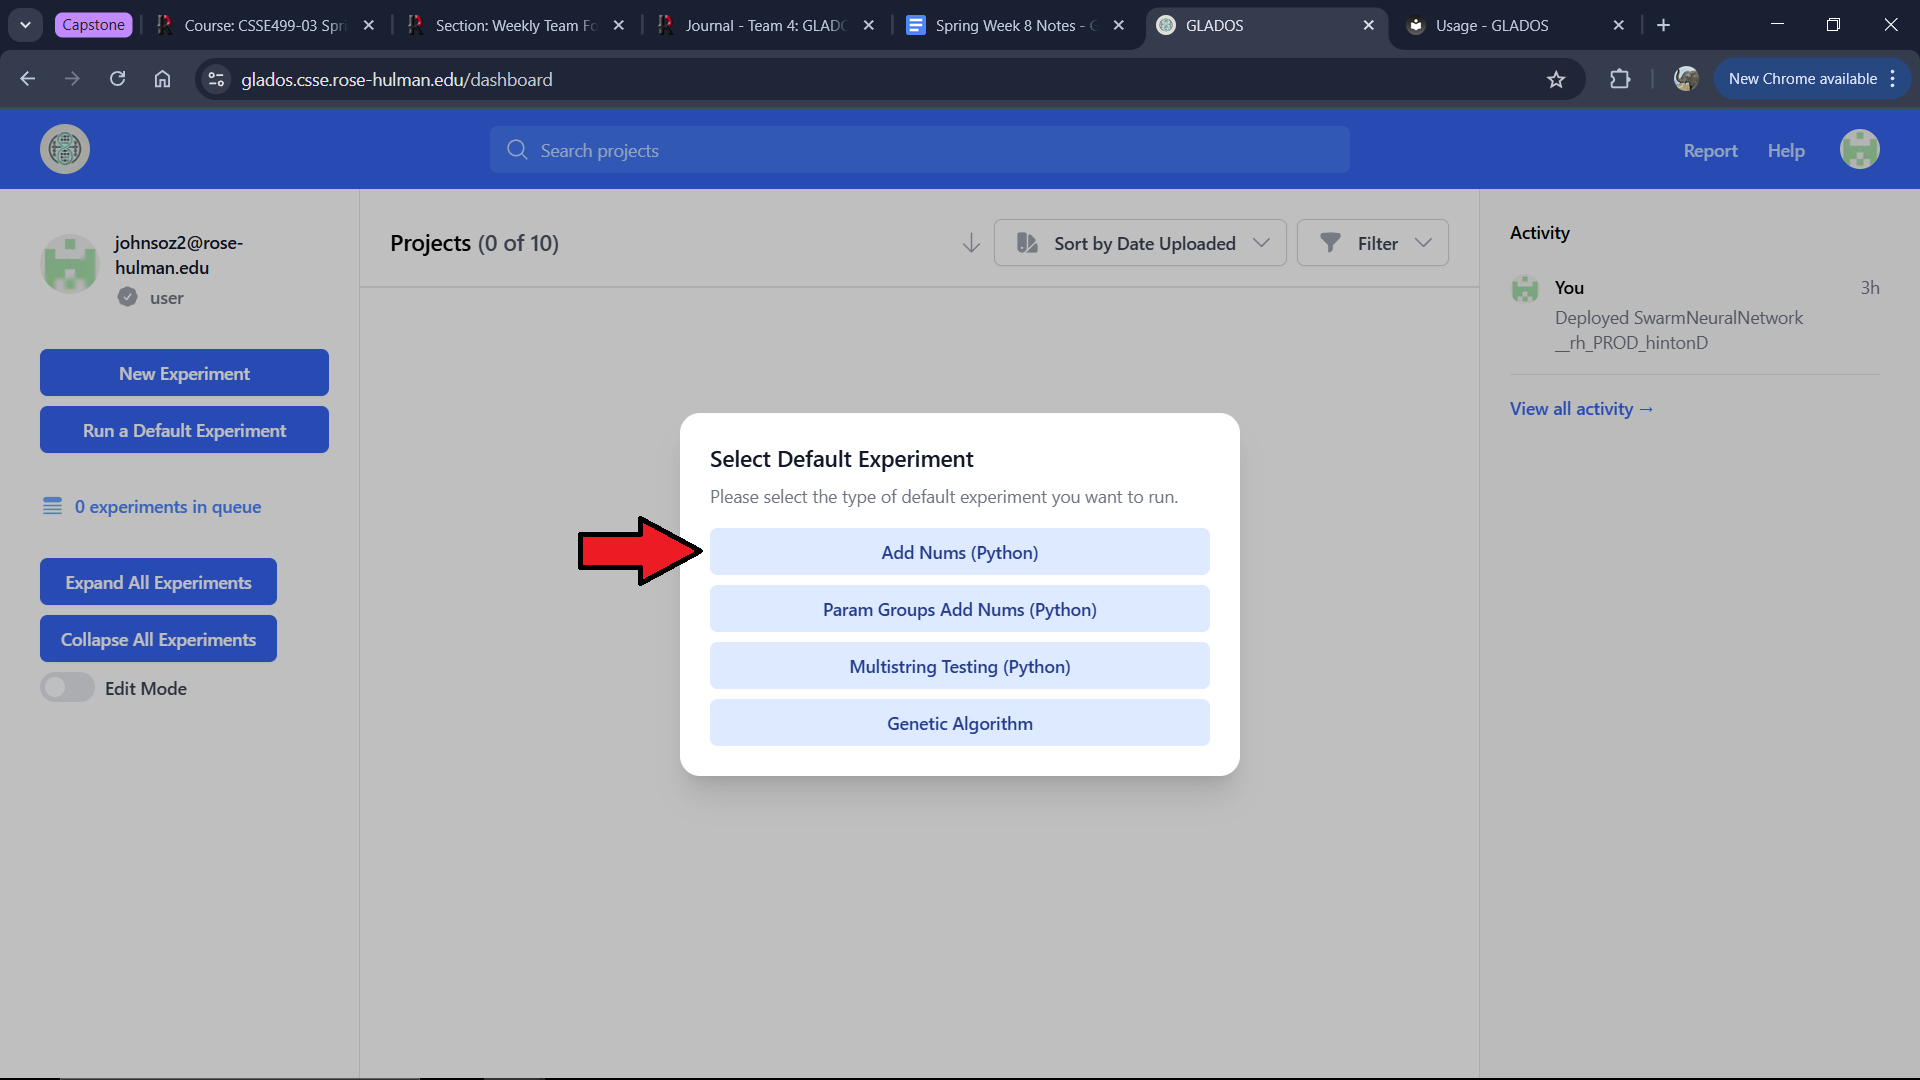
You will see a modal where you can select "Add Nums (Python)." This will present an already configured experiment.
The experiment creation interface consists of multiple tabs:
Information Tab
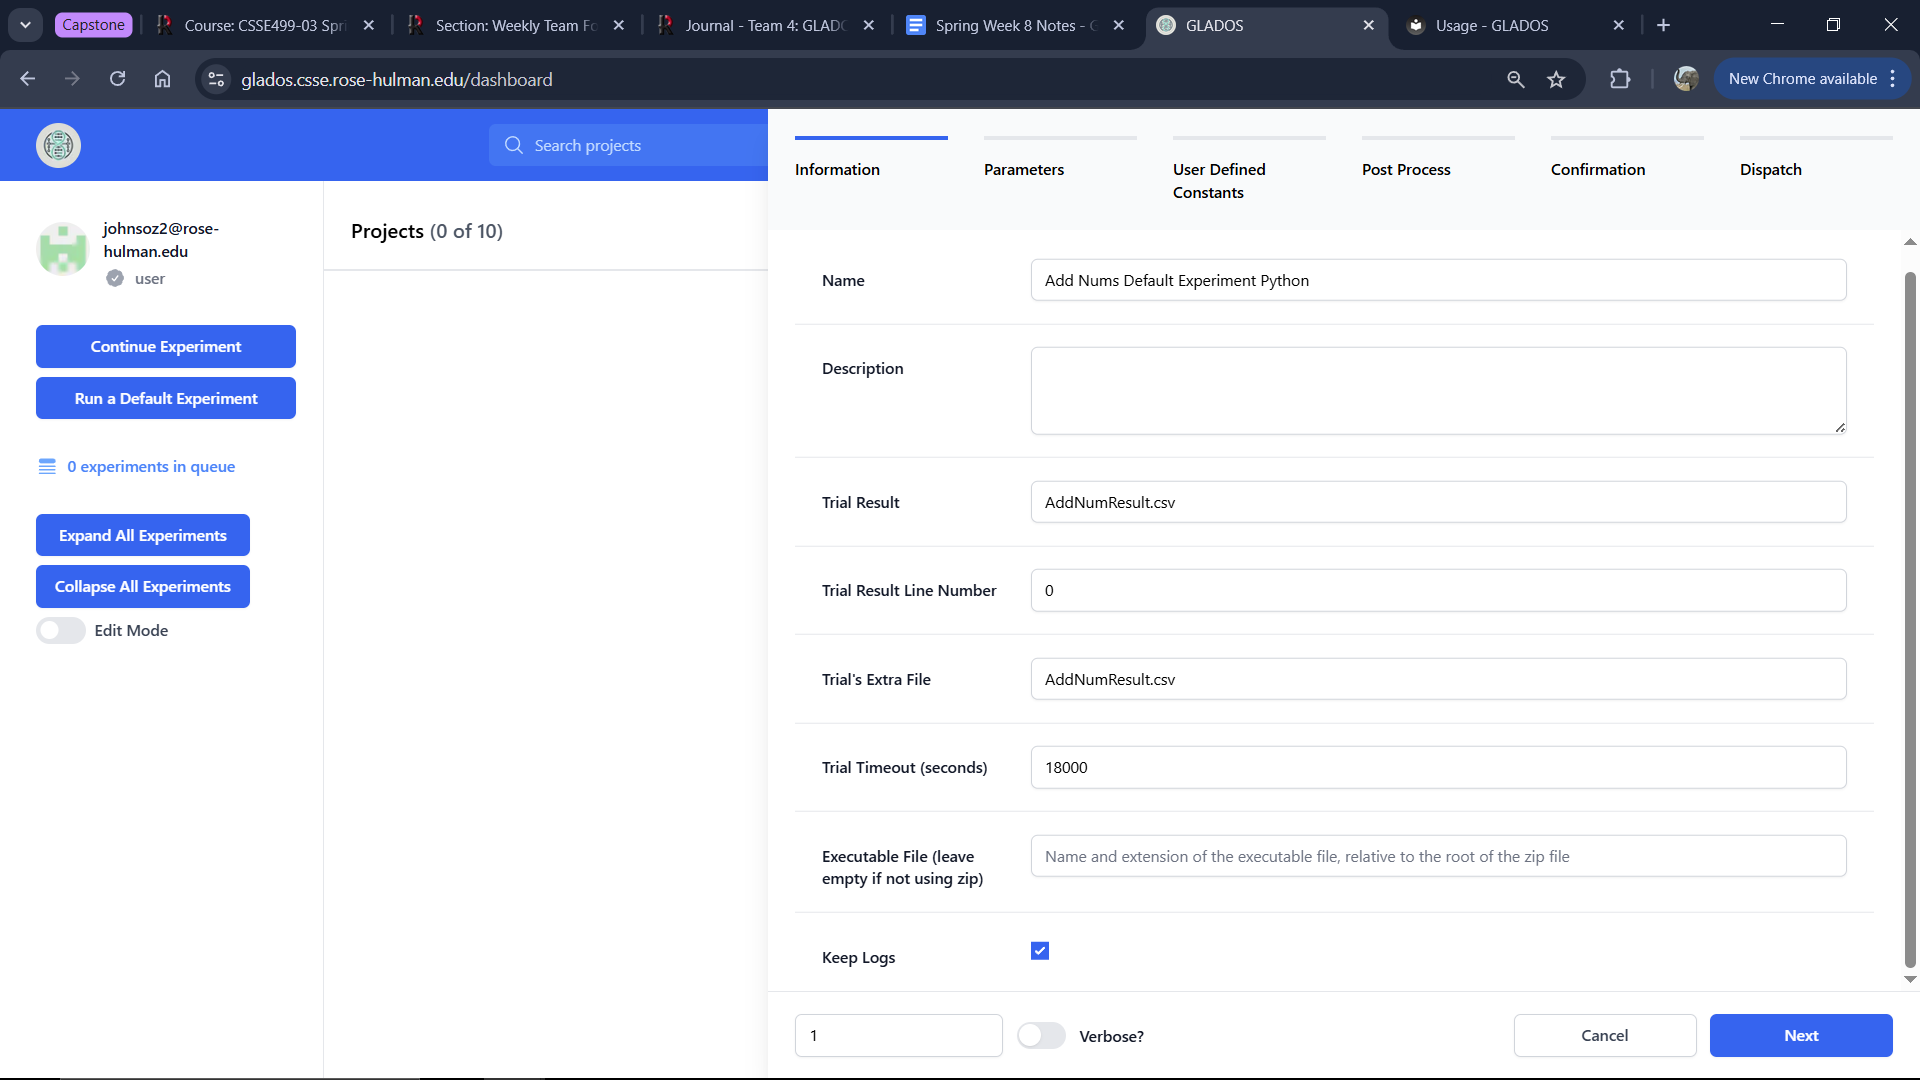
Name (Required)
The name displayed in the UI for this experiment.
Description (Optional)
A description stored with the experiment record.
Trial Result (Required)
The CSV file captured as the experiment result.
Trial's Extra File (Optional)
A folder or file included in the downloadable Project Zip after experiment completion.
Trial Timeout (hours) (Required)
The duration before the experiment automatically times out.
Executable File (Required for zip experiments)
If using a zip experiment, specify the main executable filename.
Parameters Tab
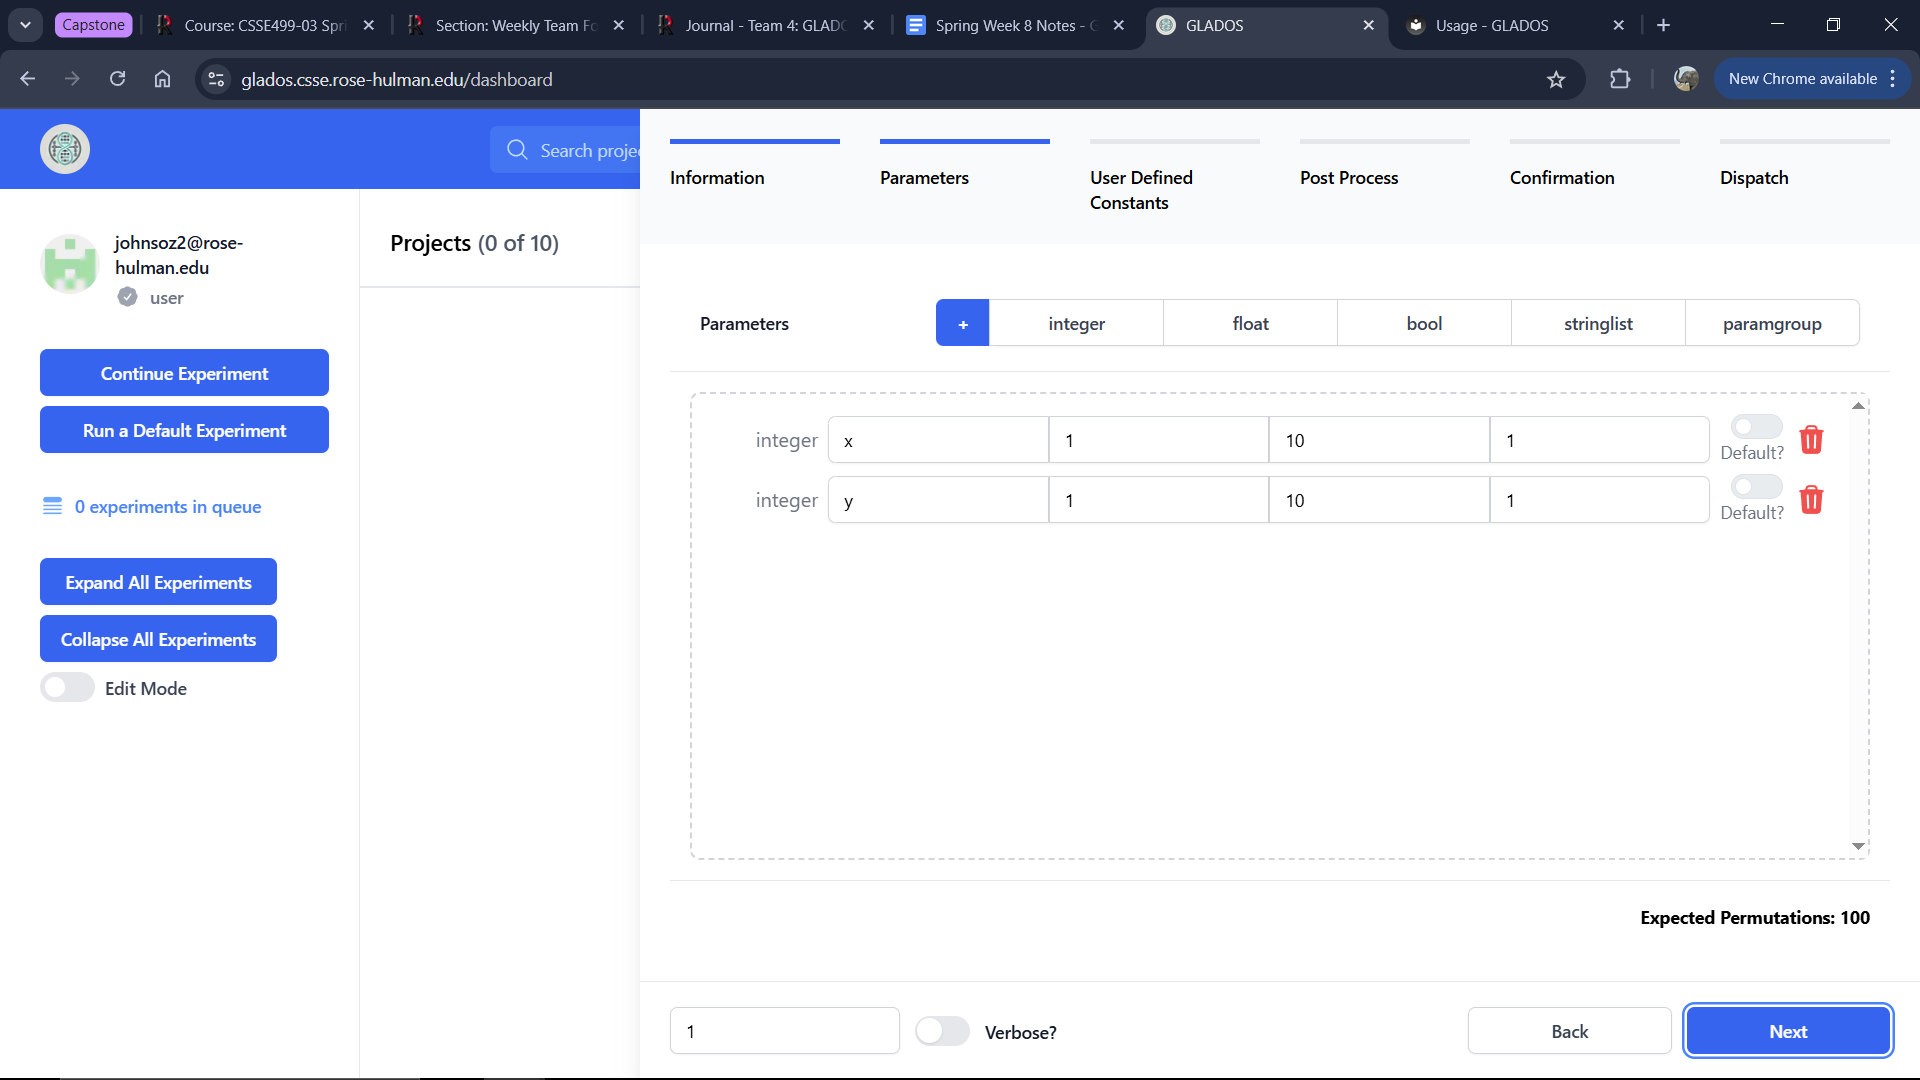
There are five parameter types:
Integer
- Name: The parameter name used in the
.inifile. - Min: Minimum value.
- Max: Maximum value.
- Step: Increment value.
- Default (if enabled): The default value used when generating permutations.
Float
Similar to Integer but supports decimal values.
Boolean
- Name: The parameter name.
- Value:
true/false - Default (if enabled): Used in permutation generation.
String List
- Name: The parameter name.
- Edit String: Defines a list of strings to iterate over in permutations.
- Default (if enabled): Used in permutation generation.
Parameter Group
- Name: The parameter group name.
- Parameters: The parameter groupings that will be tested together in an experiment run.
- Default (if enabled): Used in permutation generation.
User Defined Constants Tab
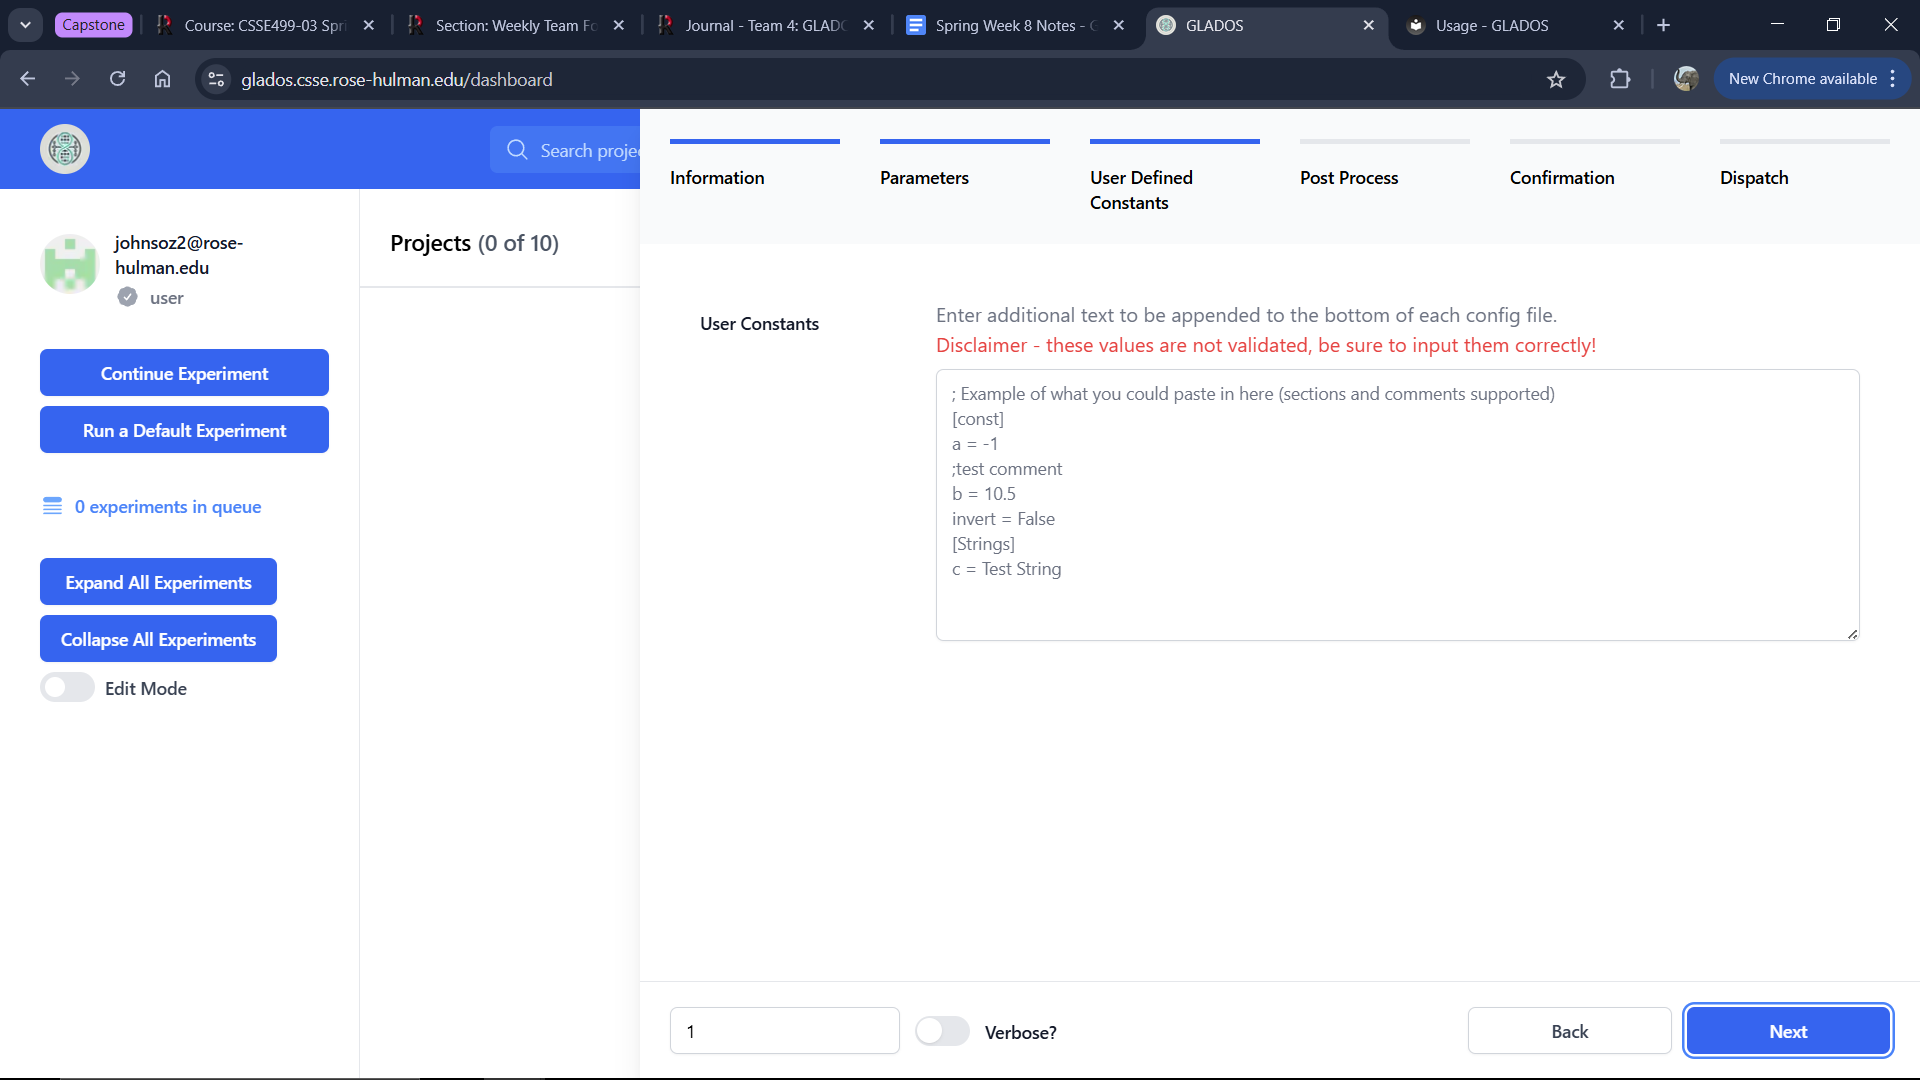
This tab allows defining a text block appended to every generated .ini config file. You can use parameters from the "Parameters" tab inside curly brackets.
Example:
[DEFAULT]
test_var = {test}
Post Process Tab
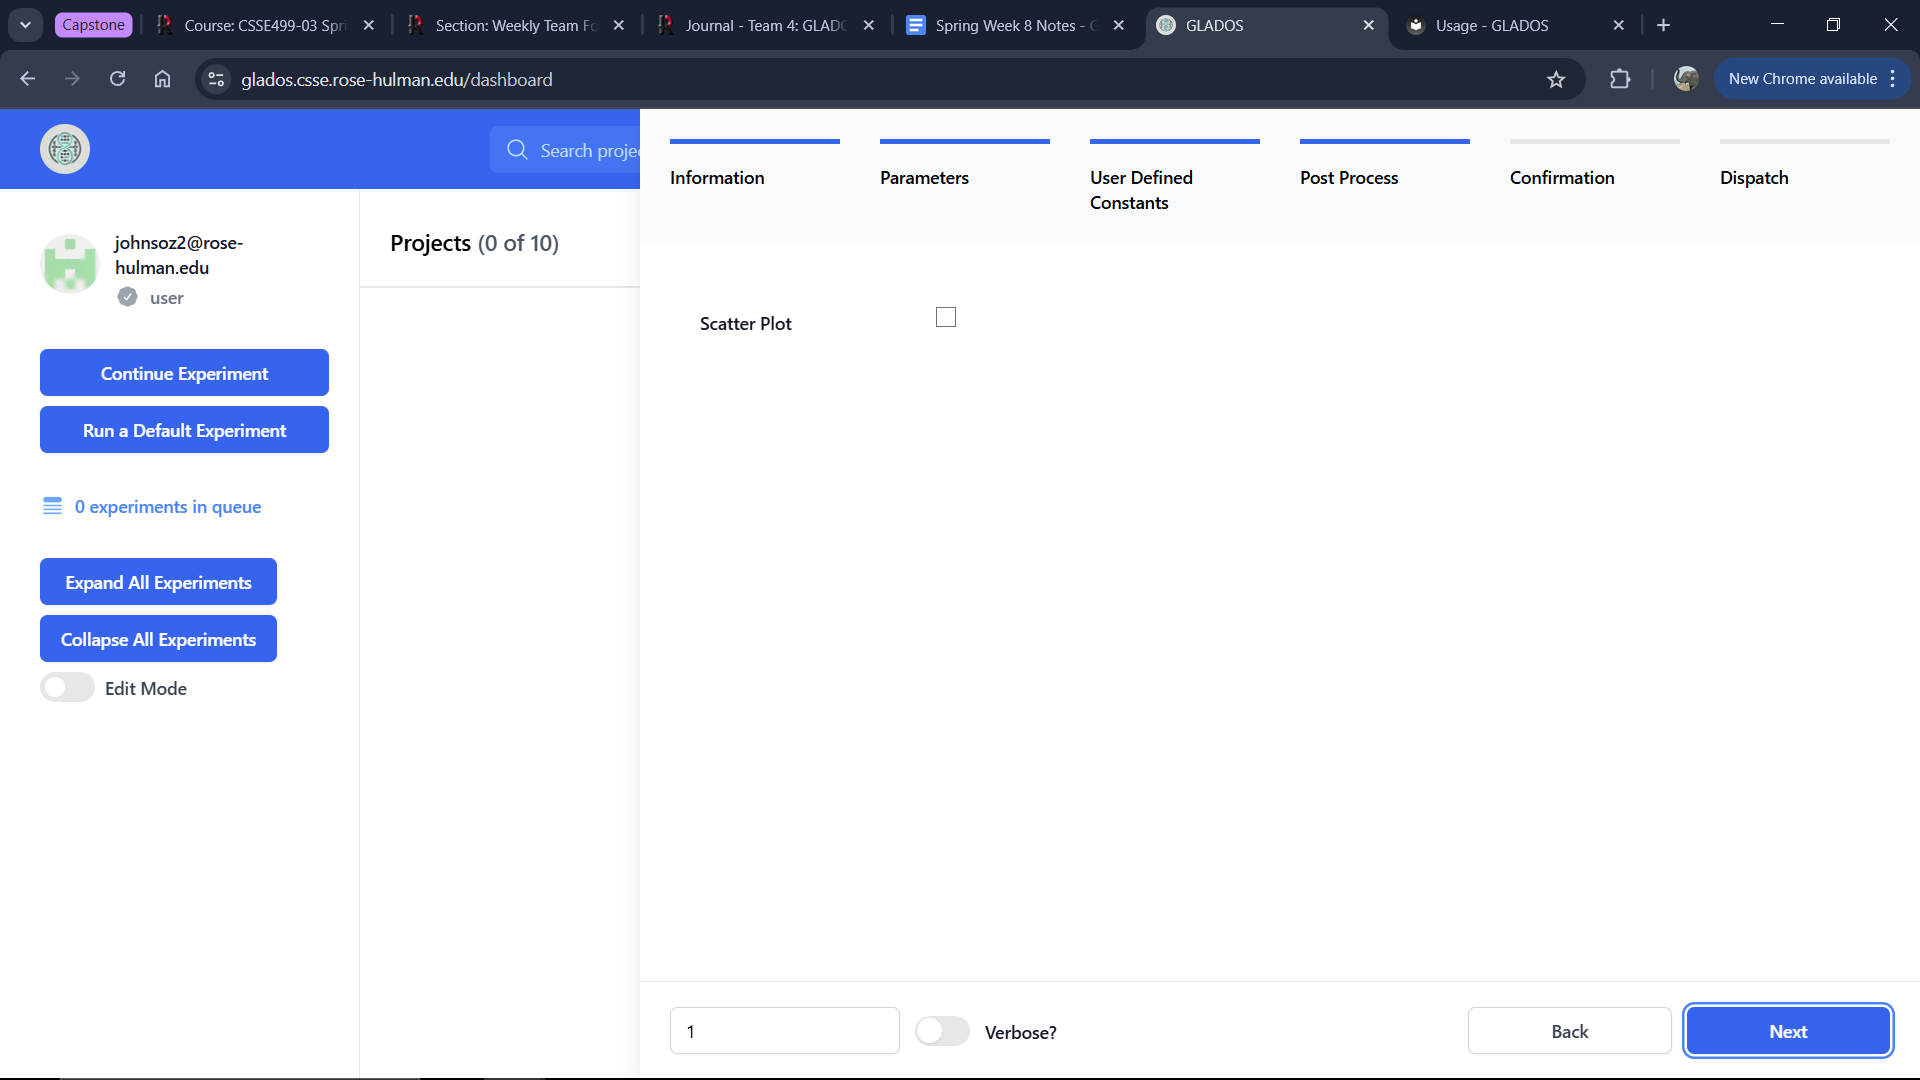
This tab allows you to include a scatter plot in the downloadable Project Zip. This feature will be replaced by ChartJS functionality on the dashboard in future updates.
Confirmation Tab
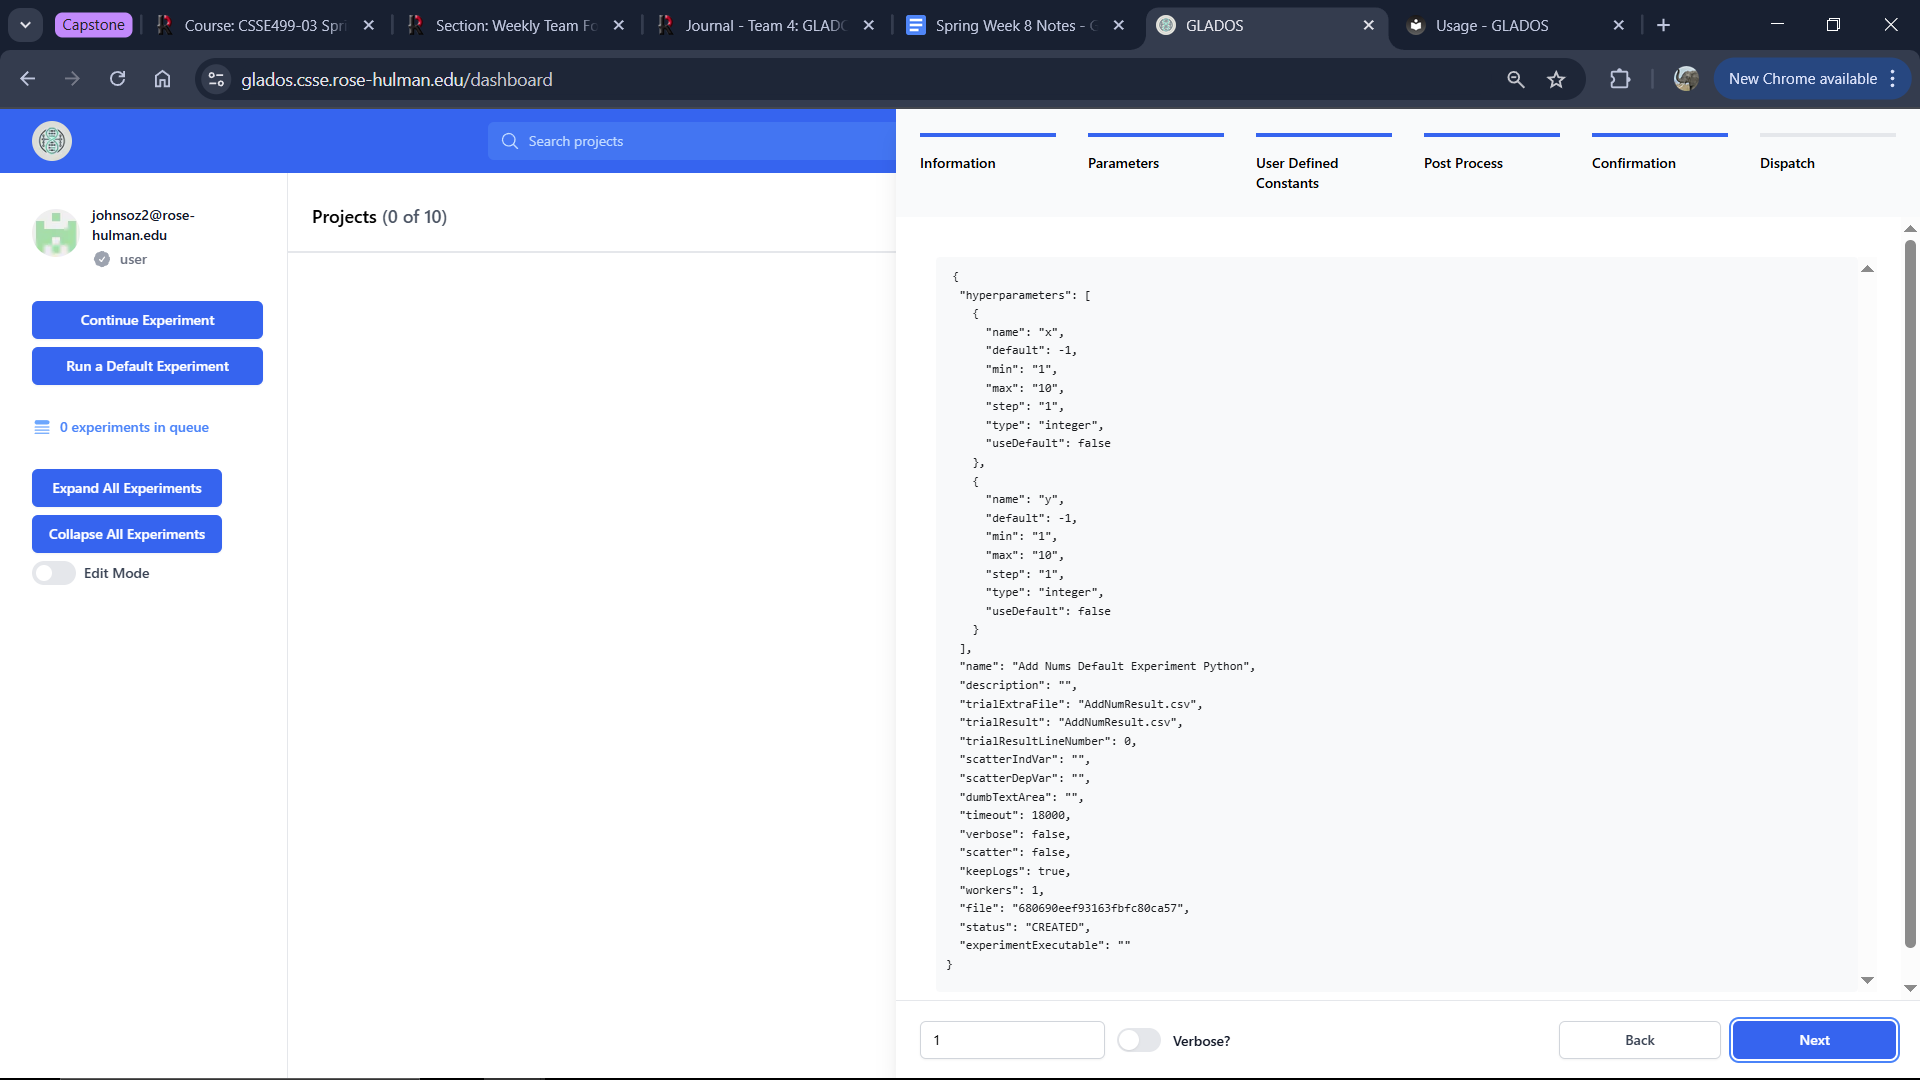
This tab allows you to review all hyperparameters and settings before running the experiment.
Dispatch Tab
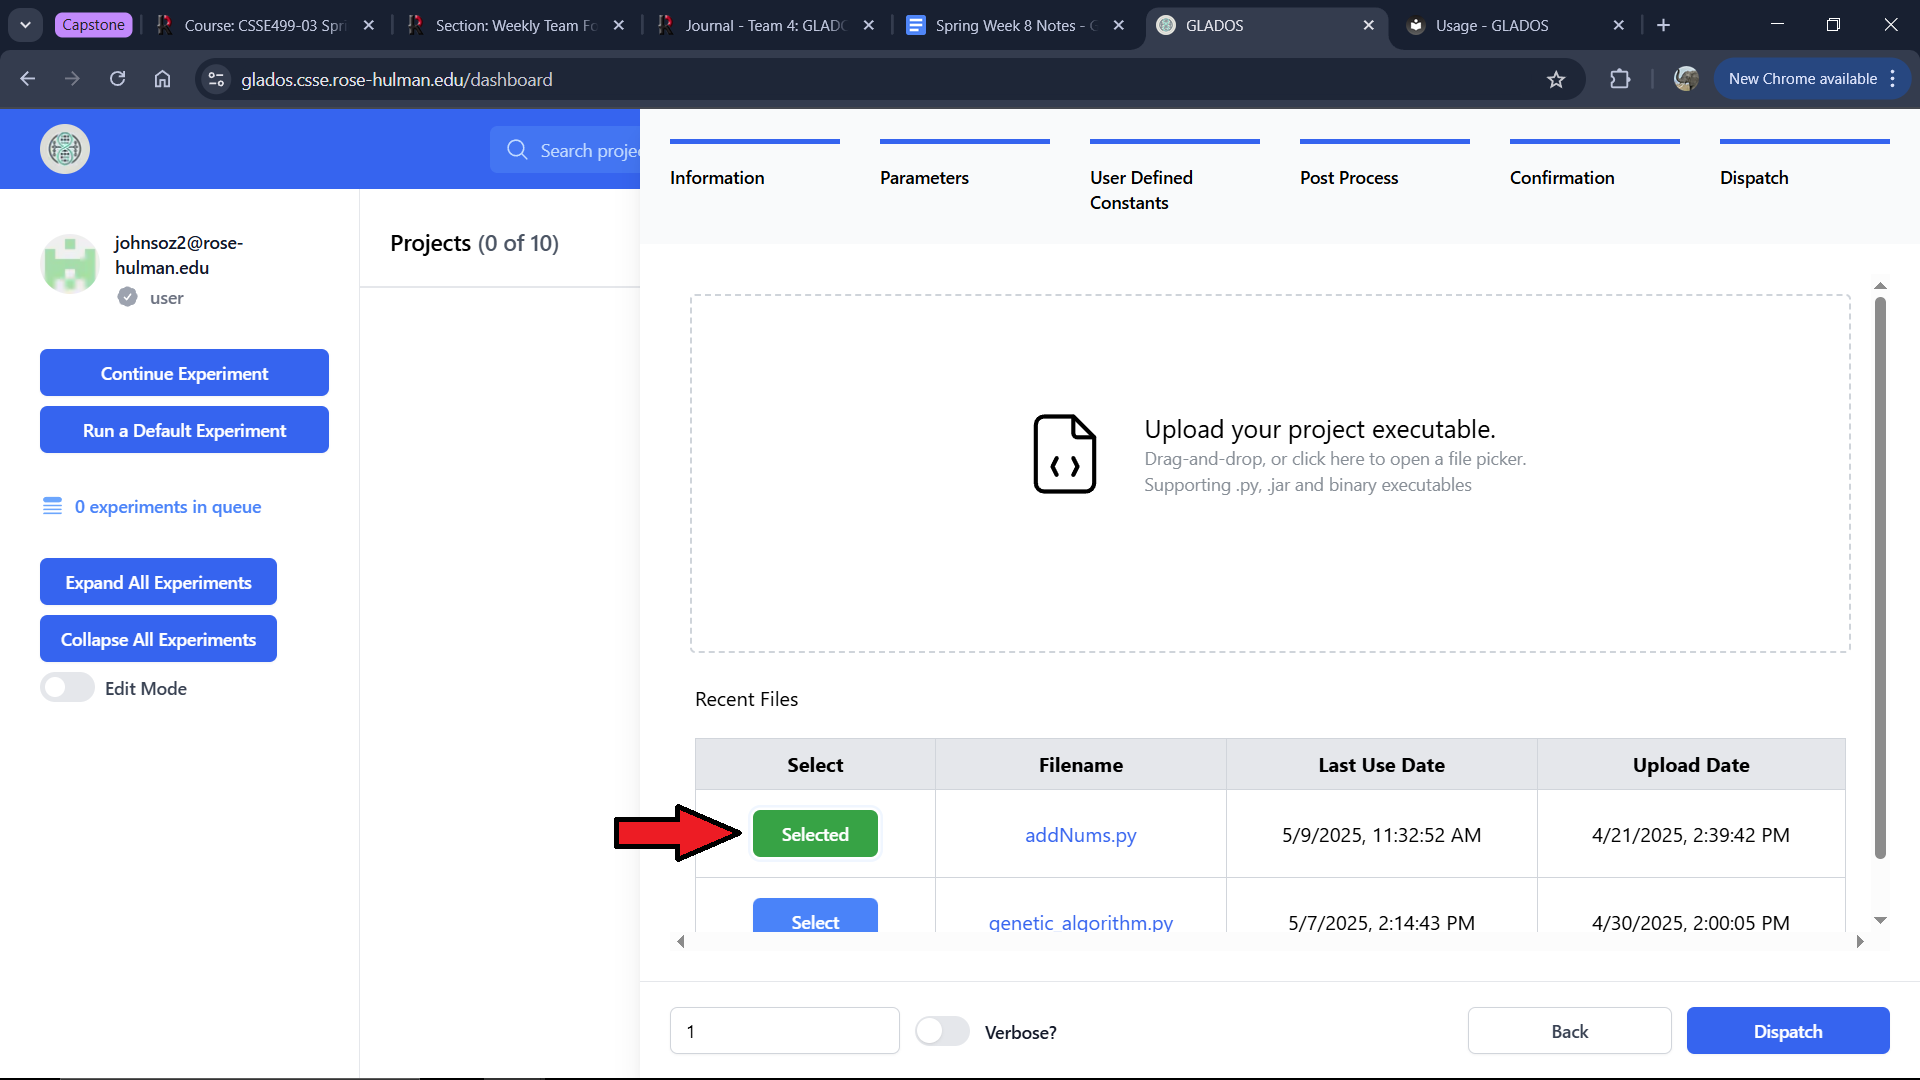
You can start an experiment from this tab by either:
- Selecting a file from the five most recent ones used.
- Uploading a new file.
If you copied an experiment, the file will be preselected.
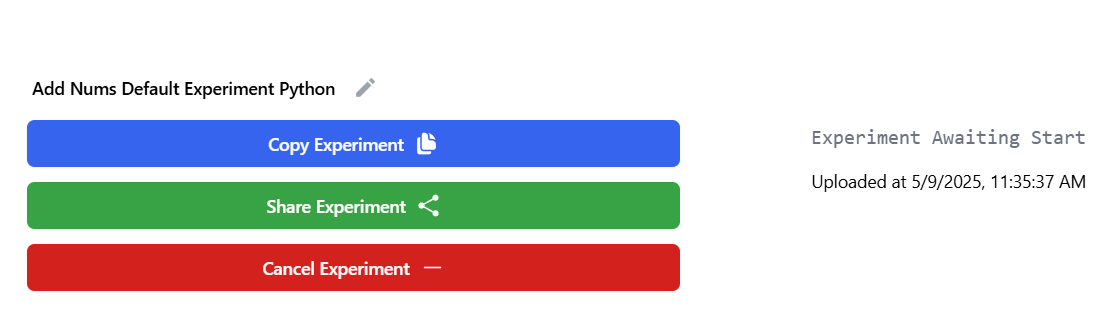
Results
After dispatching the experiment, it will take a little bit before starting.
Once the experiment starts, you can monitor progress in real time.
The dashboard will display:
- Total trials.
- Completed trials.
- Successes and failures.
- Estimated time to completion.
Example below:
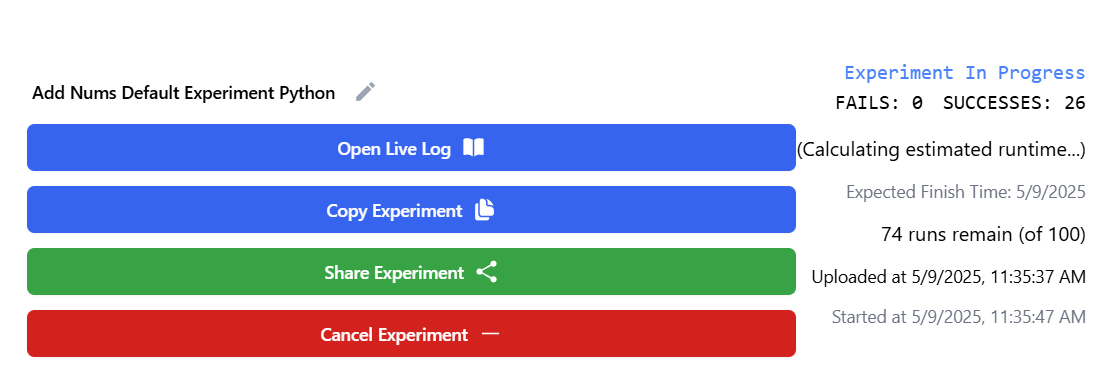
For longer experiments, you can click the "Open Live Log" button to see live log updates from the configurations files. It updates every 5 seconds. This can help you identify when an error occurred mid experiment run.
You can cancel an experiment at any time. However, small experiments may finish before cancellation takes effect.
Note: The "Expected Total Time" metric does not account for parallel execution, so actual completion may be faster.
Example of completed experiment:
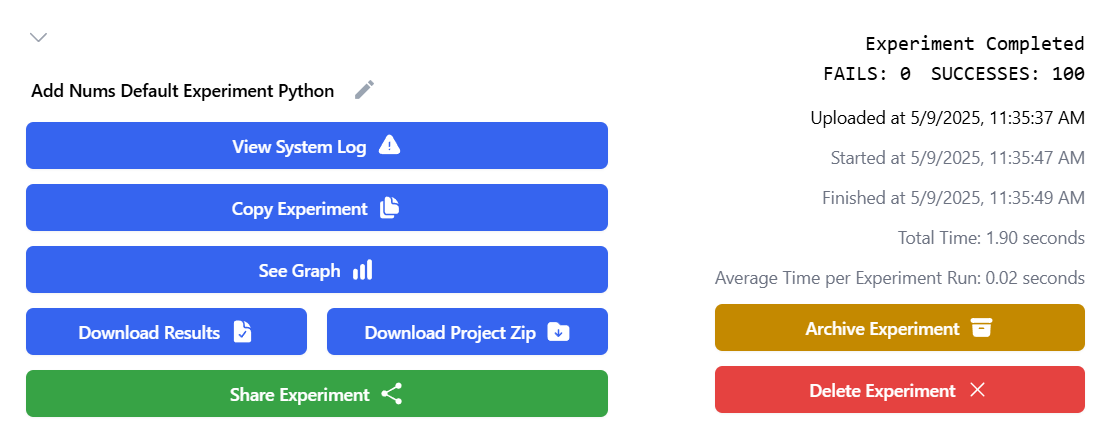
After completion, you can download the results.csv file, which contains output data and configurations for each trial. If extra files were generated, logs were kept, or post-processing was applied, a zip file will also be available.
To rerun an experiment with modified parameters, click "Copy Experiment."
To visualize results, click "See Graph" on the dashboard.
Experiments can also be shared with other users. Click "Share Experiment" to copy a shareable link. Shared users can view but not delete the experiment.
By clicking on "Archive Experiment", you can hide the experiment from view. You can see archived experiments by clicking on the "Filter" button and toggling "Include Archived".

If you don't have any further use for an experiment, feel free to delete it by clicking "Delete Experiment".
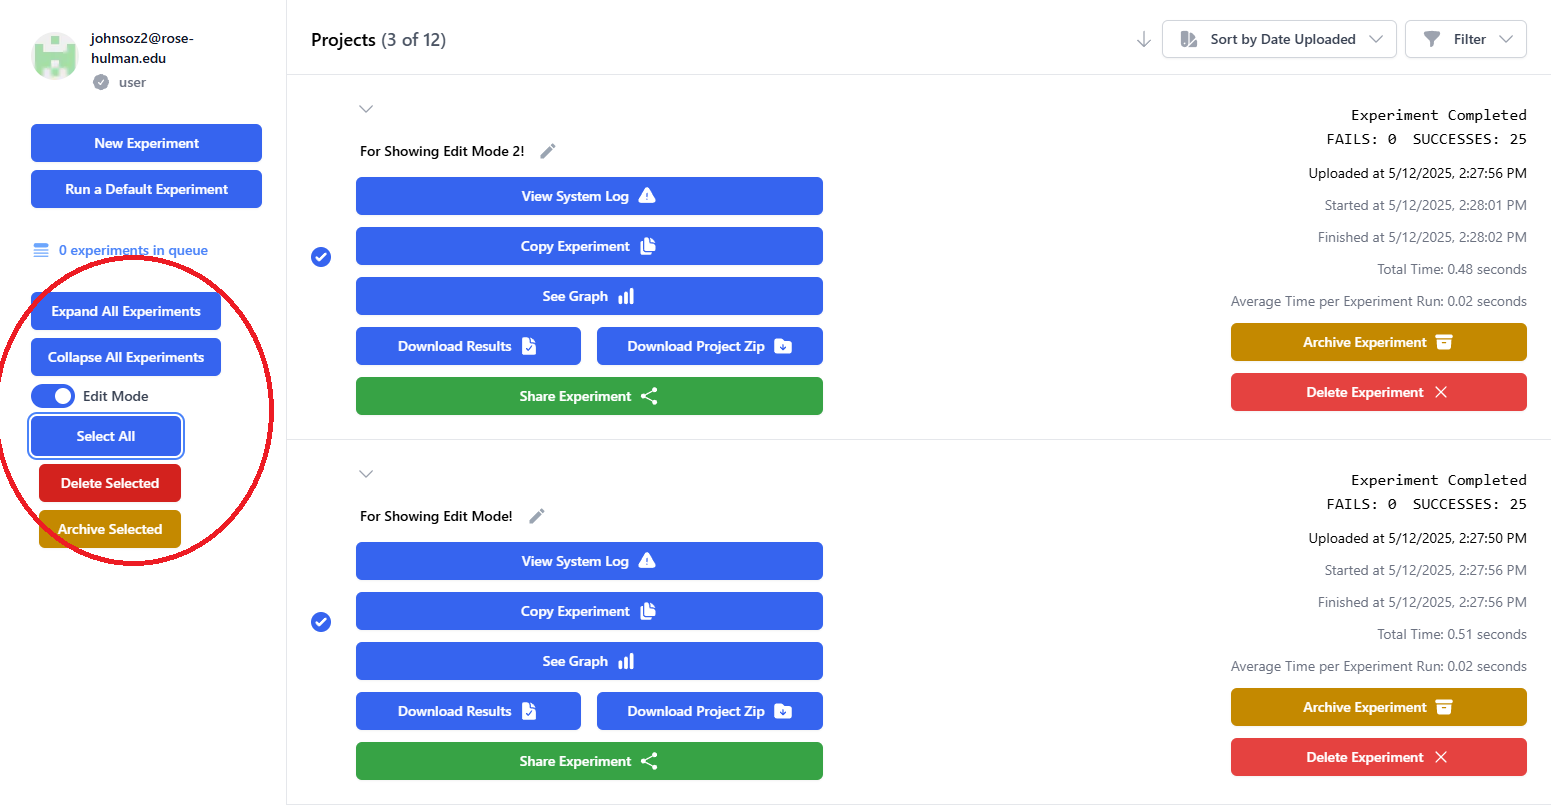
In order to select experiments, you need to turn on ‘Edit Mode’, which is off by default. You will find it below the 'Expand All' and 'Collapse All' buttons. Each experiment will have a radio button to the left of it that allows you to select it. This enables you to delete or archive as many selected experiments as you would like.
By default, experiments will be open, and will all reopen on refresh of the page. In order to close all of your experiments, you can use the ‘Select All’ button under ‘Edit Mode’.
Permutations
This section explains how parameter permutations are generated.
Example 1: No Defaults
An integer parameter test with:
- Min:
1 - Max:
10 - Step:
1
will generate 10 configurations:
[DEFAULT]
test=1
[DEFAULT]
test=2
... up to test=10.
Note: Every parameter will go under the [DEFAULT] header unless defined in the "User Defined Constants" tab.
Example 2: Using Defaults
An integer parameter x with:
- Min:
1 - Max:
10 - Step:
1 - Default:
1
An integer parameter y with:
- Min:
11 - Max:
20 - Step:
1 - Default:
11
An stringlist parameter test with:
- Values:
["one", "two", "three"] - Default:
two
will generate 21 configurations (after duplicates are removed):
[DEFAULT]
x=1
y=11
test="two"
[DEFAULT]
x=2
y=11
test="two"
... up to x=10, y=11, test="two"
[DEFAULT]
x=1
y=11
test="two"
[DEFAULT]
x=1
y=12
test="two"
... up to x=1, y=20, test="two"
[DEFAULT]
x=1
y=11
test="one"
[DEFAULT]
x=1
y=11
test="two"
[DEFAULT]
x=1
y=11
test="three"
That will be all generated permutations.
Note: Some of the examples shown were duplicates and would be removed automatically.
Chart
After the experiment has completed, you can view the chart by clicking "See Graph". This will bring up the chart modal.
Example below:
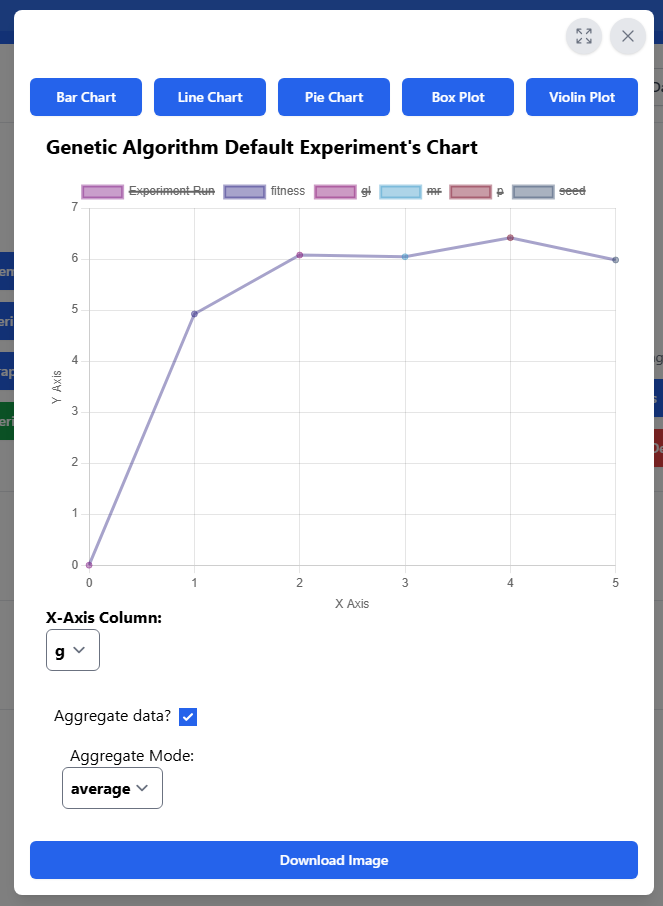
You can toggle fullscreen mode or close the modal by using the buttons in the top right of the modal.
You can change the chart type by using the buttons along the top. Currently, bar charts, line charts, pie graphs, box plots, and violin plots are supported.
The chart accesses the results file generated by the experiment, "results.csv", and separates the columns. You can select which column is used as the x-axis using the dropdown below the chart. You can then toggle the visible y-axis columns by clicking the colored boxes along the top of the chart.
You can set the y-axis range used by the chart by entering numbers into the "Y-Axis Scale" inputs below the chart. If you don't input a valid number, the chart will use its default range, which displays all data points. If you input a range that hides data points on any visible y-axis column, a warning will appear to remind you of this.
If the selected x-axis column has multiple entries with the same value, you can choose to aggregate the entries together by toggling the checkbox below the chart and selecting the preferred mode of aggregation. The y-axis values with the same x-axis value will be combined using the chosen method. For example, if you enabled aggregation using the "average" mode and your results looked like this:
| x | y |
|---|---|
| 0 | 1 |
| 0 | 3 |
| 1 | 5 |
| 1 | 7 |
The resulting chart would show two values:
| x | y |
|---|---|
| 0 | 2 |
| 1 | 6 |
Currently, sum, count (number of values), average, median, and mode are supported.
Note: Box plots and violin plots aggregate the x-axis by default, and do not support toggling of this feature.
Finally, you can download the resulting chart as an image by clicking the "Download Image" button at the bottom of the modal. The image should automatically begin downloading as a .png file. If desired, using fullscreen mode can provide a larger chart.
Known Bugs
- If an experiment crashes, users are not notified. If an experiment is stuck on "Experiment Awaiting Start" or a trial takes too long, it has likely failed. A fix is in progress.